Duplex MoniBoard Reporting
We created visual reporting web software that represents the data from Visma Global ERP
Results Achieved
- User-friendly and compelling visual data representation
- Enhancement of real-time reporting of ERP
- Better information for sales and department managers
Technology
- Java
- .NET
Introduction
Have you ever dealt with companies in which one office didn’t know what the other one was doing? It’s SO frustrating, right?
Communication and integration between the various parts of a company should always be a priority. Tools like enterprise resource planning software (ERP) are great to fix these issues.
ERP is a management software that integrates all the relevant data, business processes, and functions of a company, such as sales, purchases, warehouse management, finance, accounting, etc.
We spiced up this kind of solution creating MoniBoard, a visual reporting web software that presents data from Visma Global ERP.
The client’s needs
Our longtime partner Duplex approached us to work on the MoniBoard project.
It was supposed to be a web-based program showing real-time key figures from the Visma Global ERP system.
The main goal was to present them in an easy and understandable way for persons with little knowledge of economy and finance.
The program had to address especially sales-organizations, project managers, and department managers.
Instead, it wasn’t intended as a tool for deep financial analysis.
What we delivered
We developed, together with our partner Duplex, a visually compelling reporting system which is very user friendly.
Our solution takes data from the Visma Global ERP system and shows it in a web browser.

The MoniBoard main parts
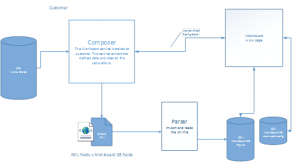
Composer: it is a service installed on the customer’s server. This extracts data from the ERP and admin part, it does calculations and transfers everything into a standard XML file.
Parser: it imports the XML file to the Moniboard database (SQL).
Webpages: the Front-end that shows graphs and figures and the Admin part for users and the role management, the input of budget figures, and other settings.
The Front-end boards
A board is a frame where the figures are presented to the user. Moniboard consists of 4 different boards
Public board: a screen report with figures aimed for a public display.
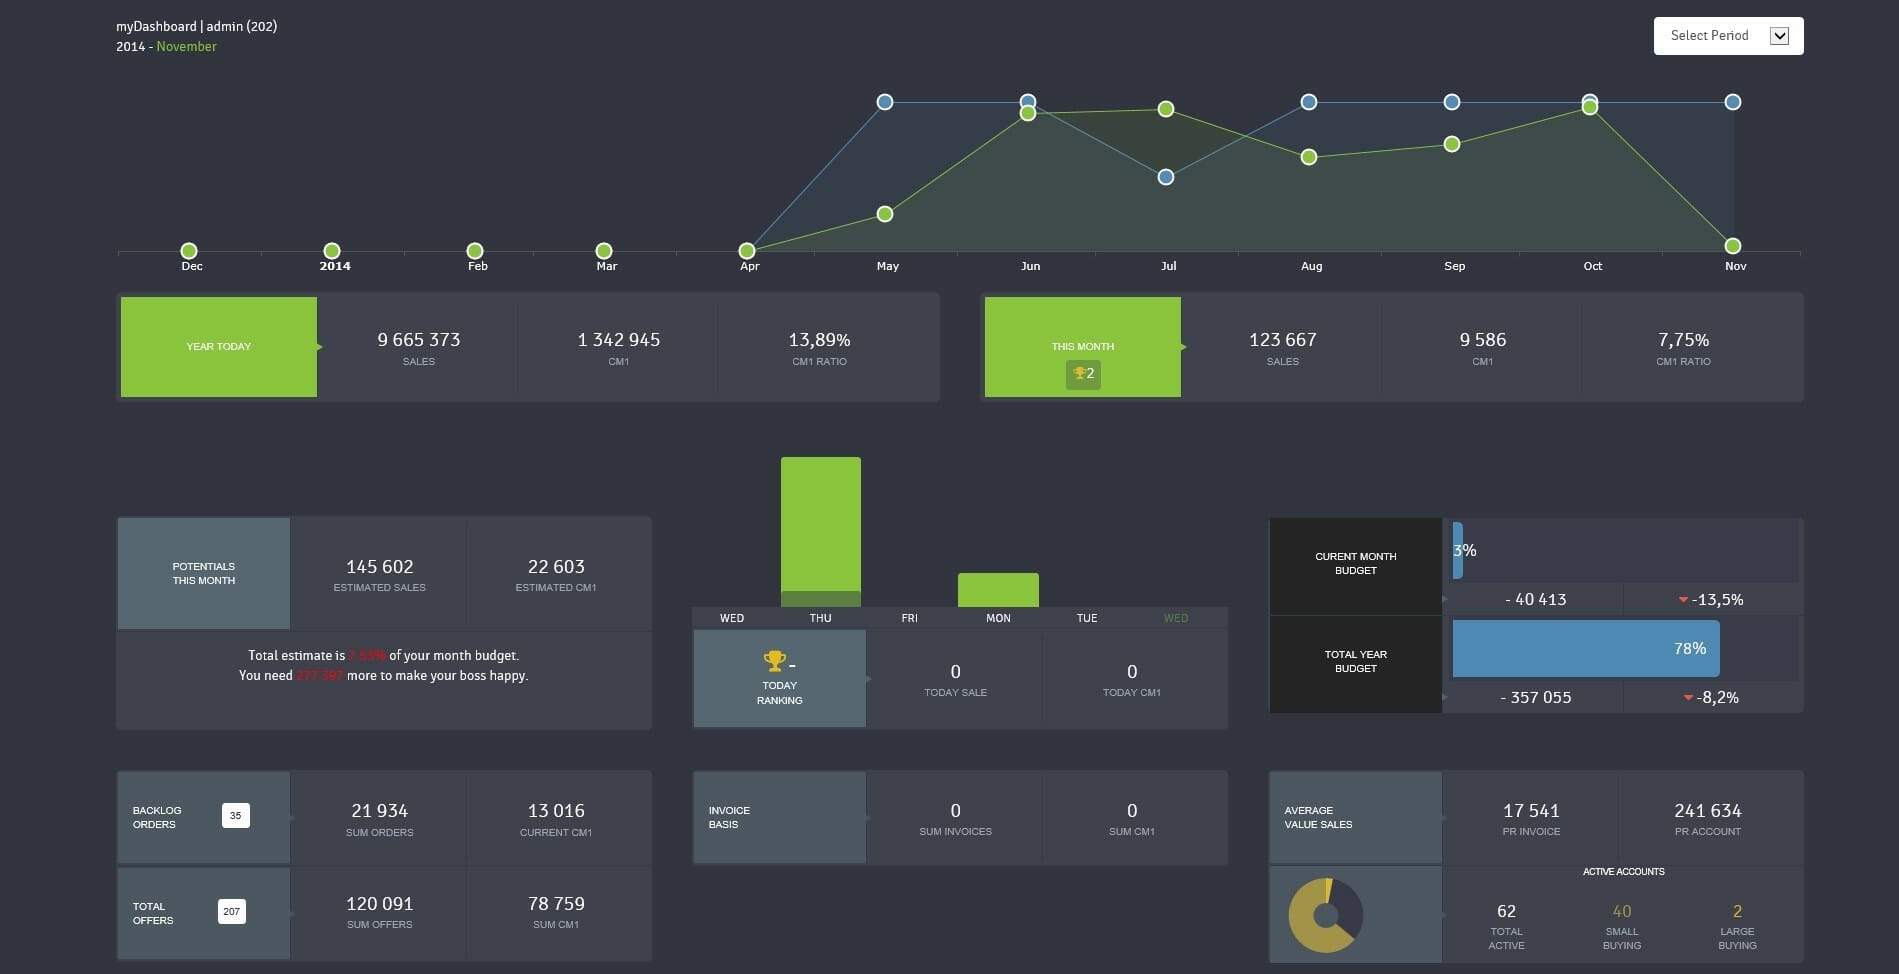
My dashboard: a report with figures belonging to each employee.
My department: a report with figures belonging to a specific department.
My Company: a report with the total figures.

Picture Front end board
Examples of reports
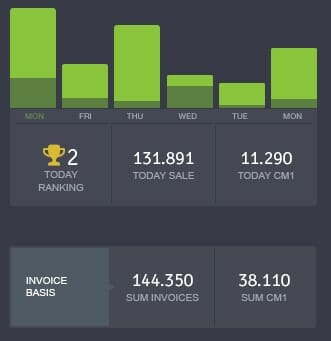
Sales today: a collection of figures showing the current status of sales
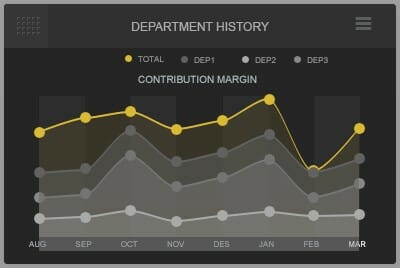
Department history: a graphical representation comparing budget vs actual contribution margin.
Year budget vs actual: it shows the accumulated budget compared to actual.
Topsellers: a table showing the top 5 sellers
Board of fame: a graph that shows the monthly performance
Potentials: it gives the user a view of his/her sales potential based on invoiced and not invoiced orders.

Year budget vs actual

Department history

My dashboard

Sales
